A visual expedition to Antarctica’s past — and a clue to its future
7 March 2024
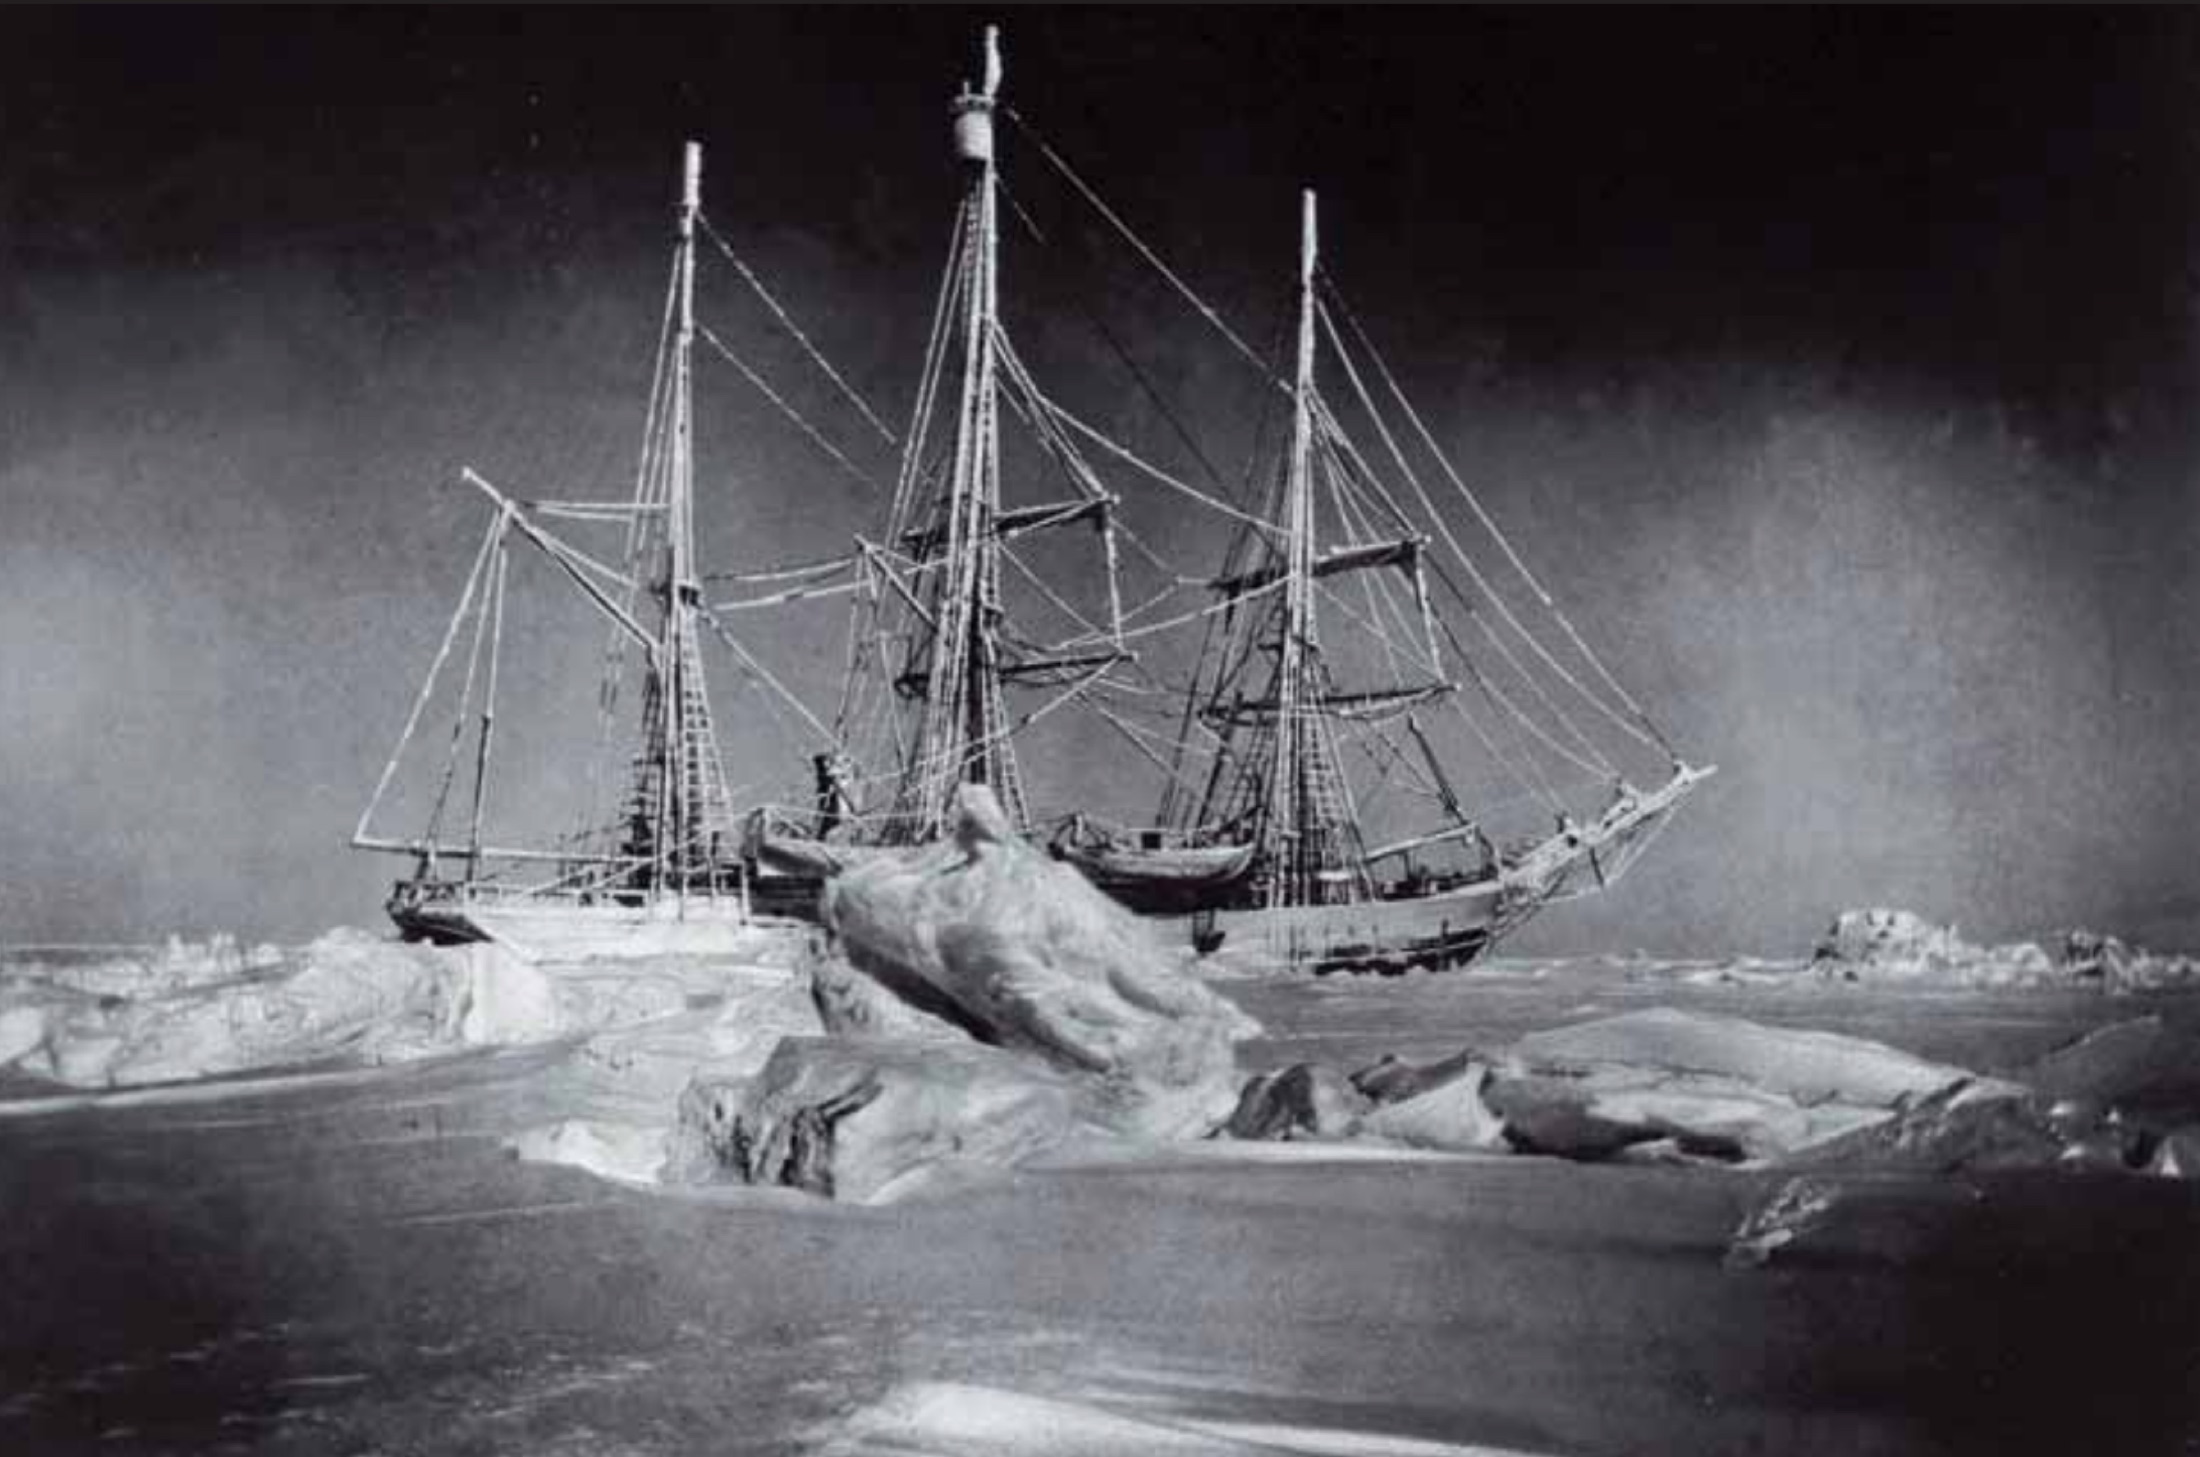
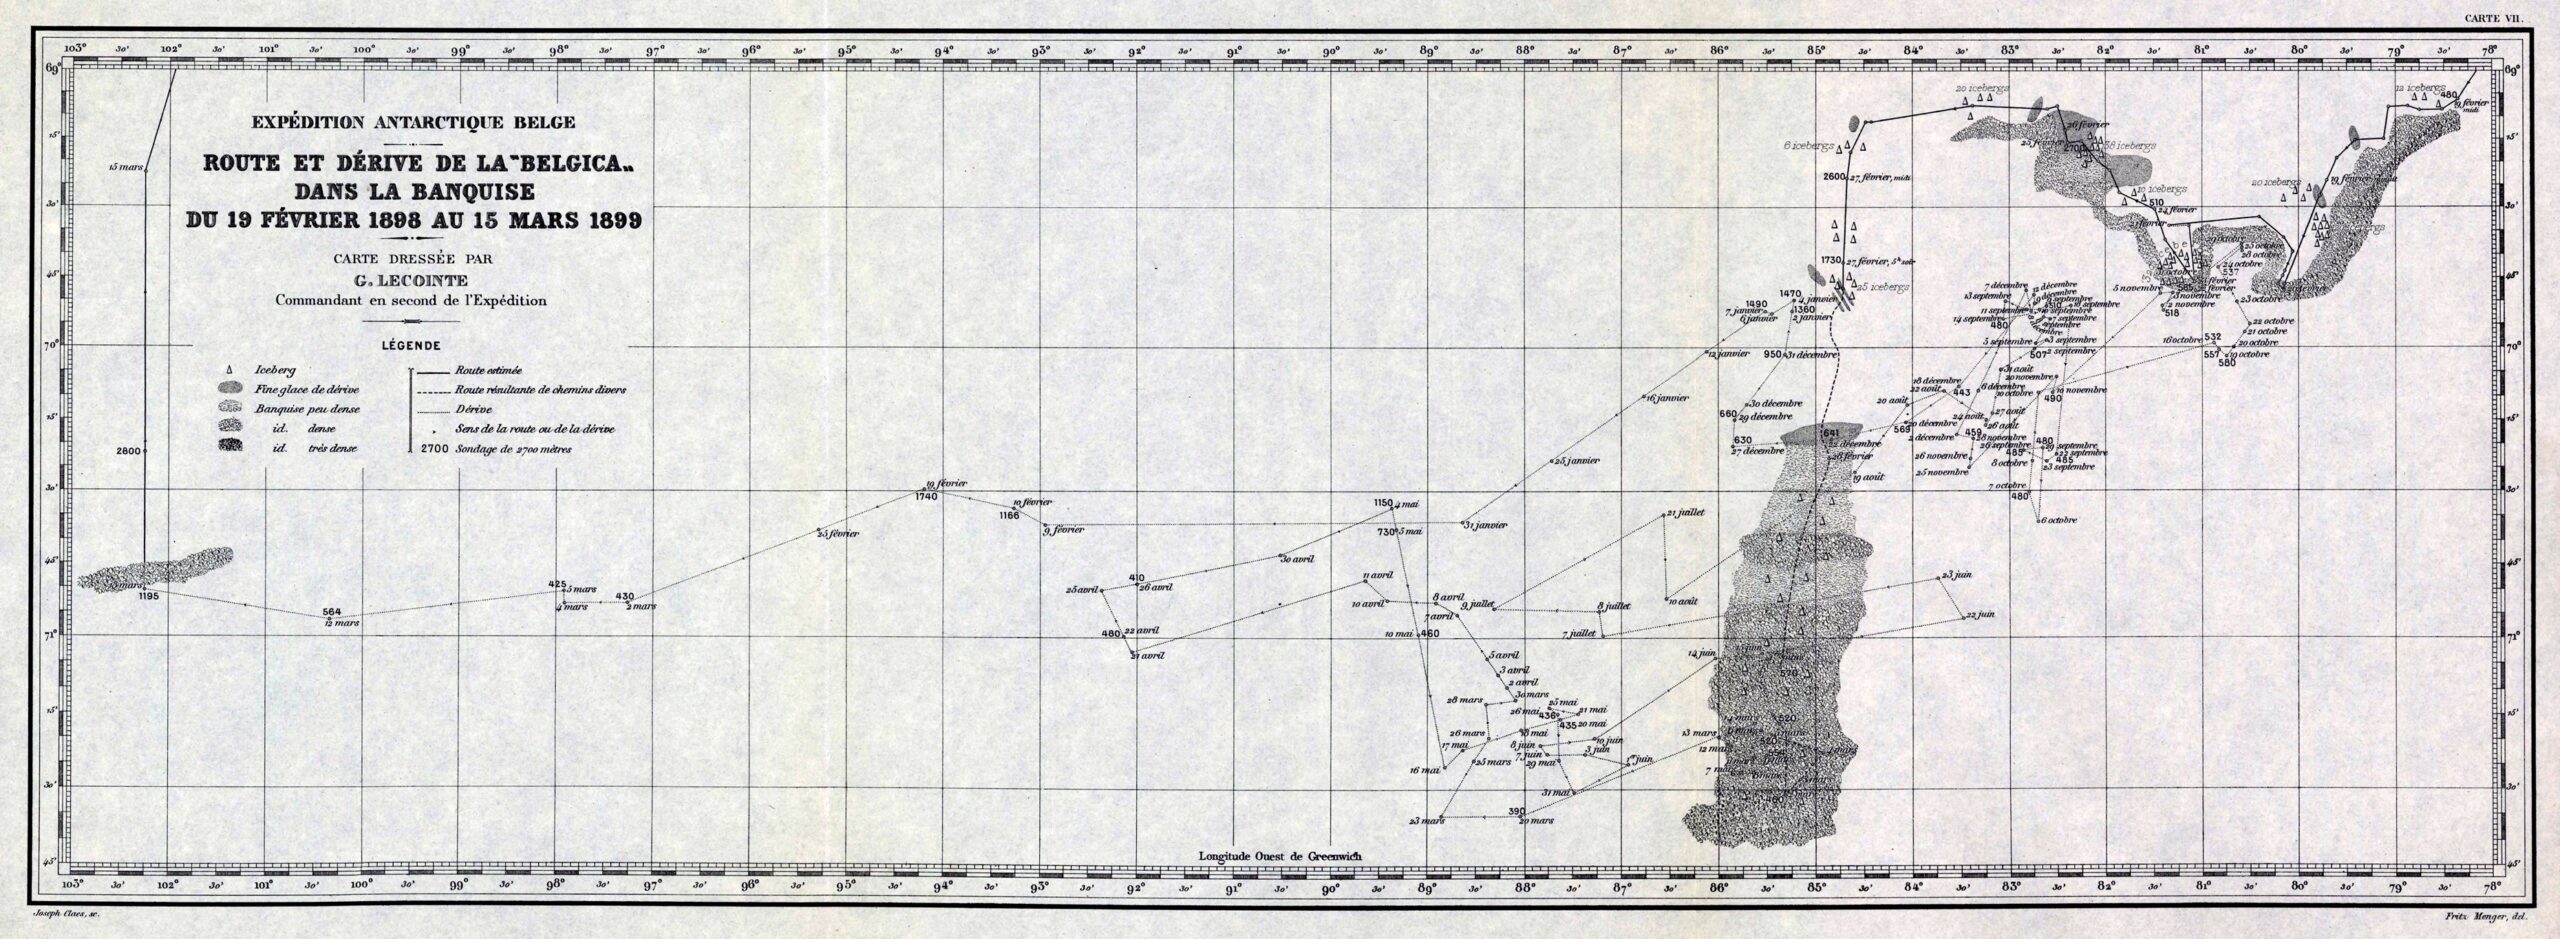
As Antarctic sea ice appears to have shifted to a different state of lower coverage, a new visualisation of the historical voyage of the ship Belgica demonstrates how much Antarctica has changed since the 19th century.
The visualisation follows the fascinating voyage of the Belgian ship to Antarctica in 1898, based on the detailed descriptions of the crew including maps, handwritten notes and journals. The Belgica crew was trapped in the sea ice for a year, with the loss of two lives and the sanity of several men on board.
Dr Edward Doddridge, a physical oceanographer with the Australian Antarctic Program Partnership (AAPP) at the University of Tasmania, said that his research into the causes of sea ice decline ties in neatly with this history of early Antarctic exploration.
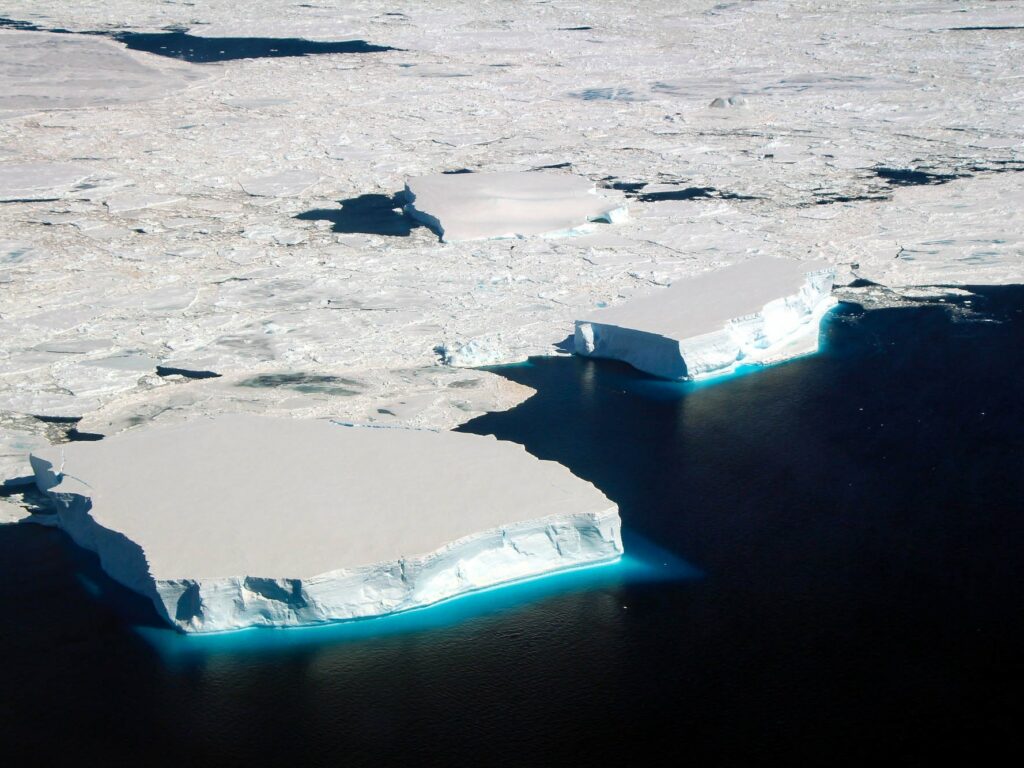
“Reading the Belgica documents, it struck me that the crew got trapped for a year in two-metre thick sea ice in the frozen Bellingshausen Sea. In that same area during the 2022 and 2023 summers, there was almost no sea ice at all”, said Dr Doddridge.
“In the last decade, Antarctica has been changing dramatically, and in 2023 the continent experienced the lowest levels of sea ice since satellite records began in the 1970s.“
“If the Belgica was travelling to the Bellingshausen Sea these days, it would be plain sailing through an open ocean unimpeded by sea ice.”
“I thought a visualisation that allows us to look into Antarctica 120 years ago and compare it with Antarctica today will help us show how alarming the loss of sea ice is for the whole planet,” he said.
Dr Doddridge collaborated closely with visualisation specialist software engineer Owen Kaluza from the Australian Earth System Simulator (ACCESS-NRI) to create the animation based on satellite data from 1978 to the end of 2023 collected by the National Snow and Ice Data Centre (NSIDC) at the University of Colorado, Boulder, combined with other assets from NASA.
“To create a visualisation, we use visual elements to represent complex data, relationships, and systems in a way that is easily understandable,” Mr Kaluza said.
“This visualisation uses a 3D model of the globe and additional layers of imagery to depict variables such as sea ice concentration, topography and sea depth.”
“Route data from the Belgica expedition was transcribed and hand interpolated from the voyage charts, along with some digitised data from the specimen collection observations made along the way.”
“Using a mosaic of images of real sea ice with increasing levels of ice coverage we recreate what the ice coverage may have looked like from above based on the satellite microwave data, which provides only a coverage percentage per grid point.”
“One of the goals of ACCESS-NRI is to make available the source code for these visualisations to the Australian research community, so researchers can use the code with their data to create their own visualisations.
“They were created with open-source and freely available tools and the source code will be published on our GitHub repository,” Mr Kaluza said.
Dr Doddridge said there is a need to understand the scale and rate of change in the Antarctic region.
“We need to send a clear message about the effects of climate change on our planet, because we are seeing these effects in places like Antarctica. Changes in Antarctica have far-reaching effects on global climate patterns, sea level rise, and ocean currents.”
Bellingshausen Sea has five breeding sites for emperor penguins, which rely on stable sea ice to lay eggs and rear their chicks. In the summer of 2022, researchers reported that the colonies were abandoned after the early loss of sea ice, causing the death of thousands of chicks and breeding failure at four out of the five colonies.
“The data show that 2023 has been completely different to the Southern Ocean of the past. We don’t know if Antarctica is ever going to experience sea-ice coverage like 1898-1899 again,” Dr Doddridge said.
The visualisation is a collaboration between the Australian Antarctic Program Partnership (AAPP) and the Australian Earth System Simulator (ACCESS-NRI) and the Terrestrial Ecosystem Research Network (TERN).
ACCESS-NRI and TERN are enabled by the Australian Government through the National Collaborative Research Infrastructure Strategy (NCRIS).