At War with a Machine to Measure Life from Gas
Tyler Rohr
The delicate balance of the natural world – what’s being created and what’s being lost – can largely be traced through the signature of the gas that’s left behind.
Plants transform carbon dioxide into the organic building blocks of life, releasing oxygen as they go. This oxygen is then used by nearly every living thing as they respire, transforming those building blocks back to energy and carbon dioxide. On the cycle goes, and in between, the oxygen that remains can tell the story.
In the ocean, where half the world’s oxygen is produced, the difference between oxygen released by microscopic plants, known as phytoplankton, and oxygen consumed by small animals and bacteria that graze or decompose those plants is known known as Net Community Production (NCP). This value is tightly tied to the net amount of carbon dioxide transformed into biomass by marine biology, and it helps us understand just how much atmospheric carbon dioxide the ocean can capture and store. If NCP is positive, that means there is a surplus of biological oxygen, fueled by autotrophic primary production; that is, more biomass is being produced than consumed. This extra biomass, we can assume, is likely sinking down into the depths of the ocean. The larger the NCP, the larger we can assume the carbon sink is. Alternatively, if NCP is negative that means there is a deficit of biological oxygen, fueled by heterotrophic secondary production, suggesting carbon is being rapidly recycled between plants and animals before it ever gets sequestered. In this way, Net Community Production can trace the single, beating, breath of the ocean.
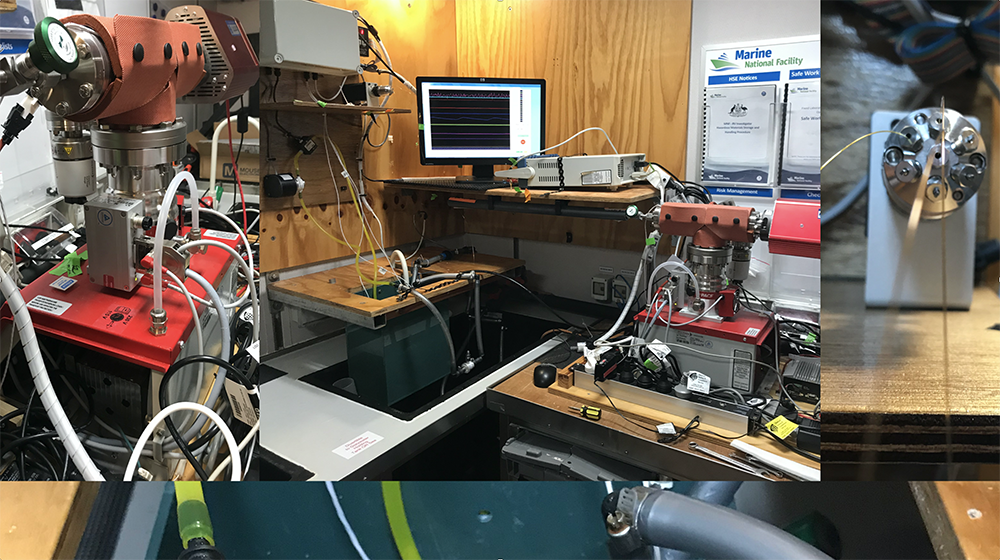
That’s why, when we set out into the Southern Ocean this Summer, we made sure to bring a stethoscope; or more technically speaking, an Equilibrator Inlet Mass Spectrometer. This device, the EIMS for short, is really, quite sophisticated, but jerry-rigged in the cramped corner of the already claustrophobic Underway Laboratory it looks more like something Dr. Frankenstein scraped in his early days, long before his promethean inclinations came to bear. The brain of the machine, the mass spectrometer itself, is pierced by a single capillary that feeds it. Inside, it hums ominously as magnets rip apart the molecules within, sorting them, incredibly, by mass. Below might be its lungs, a powerful vacuum, which gasps concerningly through the night. To the left, it’s guts are scattered across a different shelf entirely, splayed out for the world to see. Every piece is screwed in or strapped down with all the grace of a hurricane. You see, when oceanographers say they’ll make something seaworthy, they don’t mean they’ll make it pretty, they just mean they’ll make it work.
Except sometimes, especially when seas are rough, it can feel like all the forces in the known universe have colluded, specifically not to let things work. Several days south of Hobart, my stubborn stethoscope was still on the fritz, and time was running out to repair it. Our goal was to compare the NCP at two different sites and we had just arrived at the first one. Balancing atop a small plastic stool while the ship pitched mercilessly over 6m swells, I steadied my hand around the world’s tiniest wrench and began to secure a hair-thin wire in place for what felt like the thousandth time. The trick, I had been told, was to keep the wire exactly the right distance from the back of the inlet; the problem was that the borderline surgical precision required to do this was not at all agreeable with the rollicking sea.
These wires were coursing with gas extracted from seawater fed in from beneath the ship, and if the connection wasn’t just right, air would leak in and contaminate the sample. The point of this whole contraption was to measure how the oxygen concentration was changing due to Net Community Production. Unfortunately, measuring oxygen alone, which can be done with a much less intimidating piece of equipment (an optode), isn’t enough. We want to capture the biological response, but biology isn’t the only thing that changes the oxygen content in the surface ocean; physics is at work as well.
Moving south the water temperature decreases, increasing the amount of space left inside to hold gas. Concurrently, as the sea surface gets tossed below breaking waves small bubbles inject oxygen from the air, complicating what percent of oxygen occupying that space comes from the plants below and the sky above. Thankfully, there is another gas, argon, that has strikingly similar molecular properties to oxygen, but isn’t affected by biology at all. Leveraging this distinction, we can look at subtle changes in the ratio of oxygen to argon (O2:Ar) to help remove the role of physics and isolate the biological signature. This is where the mass spectrometer comes in. Seawater is pumped through an equilibrator cartridge that creates a sample of gas with the same constituents as the gaseous species in the water. This gas is then shot into the belly of the beast where its molecules are ionized and pulled apart magnetically into different baskets, allowing us to measure the O2:Ar ratio of the seawater from whence it came. That is, provided there isn’t a leak. No matter what I did, the data kept coming back confounding, indiscernible from sampling straight air. If I wanted to measure the O2:Ar ratio of air I could have stayed in Hobart.
No matter how many times I replaced the capillary wires or redid the connections, nothing worked. Something else had to be the failure point. Iteratively, with some gracious help from shore, I was able to hone in on a piece called the Valco Valve, required to mechanically switch between one line connected to the equilibrator and another one connected to nothing at. This second line is needed to periodically sample the air for calibration purposes, but if the juncture in between wasn’t sealed then both lines would effectively be feeding air into the mass spectrometer. Briefly alive with the transient thrill of identifying the problem, I quickly turned my attention to how I could actually solve it. Luckily, tucked away in the Clean Dry Lab, were four large boxes, filled to the brim with spare parts and no small dose of hope.
Reflecting now, I probably should have known this would be a temperamental instrument when I was given three times as many spare parts as actual ones, but at the time, boy was I grateful for all of them. It wasn’t long though, before I had dug through all four boxes, twice each, without a single Valco Valve in sight. Just when I began nervously contemplating the implication of whether we could instead repair the broken valve, I was struck with the sort of Des-Ex-Machina revelation that I thought 2020 had rendered impossible. Buried beneath the chlorophyll sampling bottles stuffed below the filtration bench, there was a blessed fifth box. I sat tepidly for a moment, staring with a longing desperation at the sealed lid, then tore in with the ferocity of a child, set free, first thing Christmas morning.
Miraculously, there it was, resting peacefully in its little carboard bed, waiting patiently to the save the day. Quickly, I affixed the new valve in place, booted up the machine, and literally leapt for joy when I saw the leak was fixed. Now I just had to turn the pump on and let the EIMS take it from there. The pump is controlled by an electric feedback mechanism designed to pull seawater through the equilibrator cartridge at a constant rate. Ideally, initial large oscillations are quickly damp out. Not this time though. This time the timeseries tracking the flow rate looked like something Jackson Pollack drew. Immediately, I sunk all the way into the floor. Feeling sorry for myself, I moped reluctantly back down the hall to retrieve the tool box I had put away only moments before. For some reason I kept it three labs away, as if distance itself could preclude its necessity. By now the upper panel of the box had become so disintegrated that when I lifted the handle, the box promptly and decisively exploded, vomiting up the entirety of its contents in an act of furious and highly unappreciated protest.
After a quiet moment, some self-reflection and a bit of a pep-talk, I managed to reject the surge of self-pity and gathered my wits alongside the rest of the mess spewed out across the floor. I made my way back to the Underway Lab, and got to work. Half a day later, filled with some ham-handed plumbing, a replaced flow meter, and an unreasonable amount of reboot cycles, it seemed, somehow, I had finally fixed the pump. The EIMS, it appeared, was finally in working order. Sure enough, save for a few minor episodes, it has behaved the whole way home.
The result is over a month of nearly continuous O2:Ar data, which when incorporated with other observations of vertical mixing, surface temperatures, and wind speeds will give us a fairly comprehensive account of NCP at three unique Southern Ocean sites and the transects in between. In the coming months we will pair this record with other biogeochemical and physical data to paint a picture of how different mechanisms in different places variably control the rate of primary productivity, how much of that biomass is consumed, and how much can escape the surface ocean. Ultimately, we will gain insights into how much carbon can be sequestered by the sea. The hope is that we will learn enough to extrapolate this information to help inform how the Southern Ocean writ large is buffering climate change, and to what degree we can expect that continue.
Looking at the time series now, those early days of chaos seem far away, but a calcified respect for seagoing oceanography remains. At home, I am mostly a modeler. The data I use comes from computers, crunching away on the equations I feed them. Compared to the time and space covered on a typical voyage, the datasets are vast and innumerable, but sadly, they are not real. These models can help us extrapolate what we have learned in the field, but they are only as useful as the observations that ground them. It is easy to forget that when higher resolution is few lines of Fortran away, but it would be wise to remember that in the actual world, more data, or any at all, requires the sort of time, care, and patient devotion that you can’t bake into your code.
BELOW: Time series of various variables throughout the voyage. Time spent at each site it bracketed above and a description of the variables and their use is provided to the right.
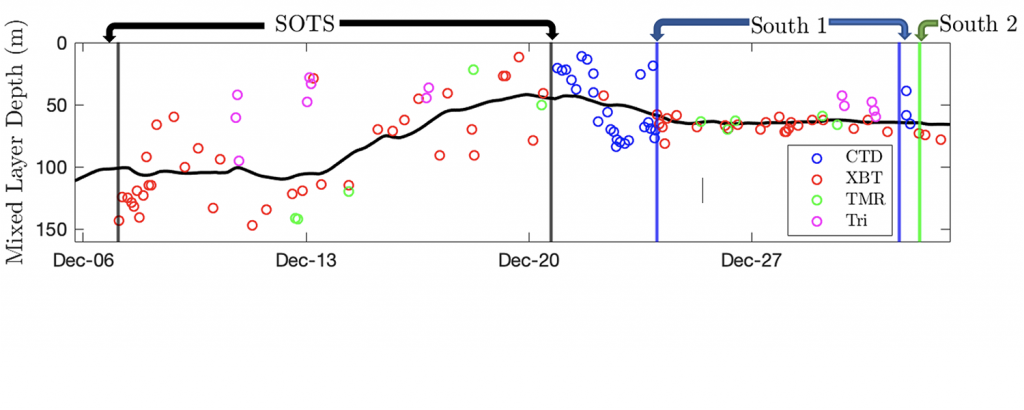
a) The Mixed Layer Depth, the part of the surface ocean being rapidly circulated, is important to understand how diluted the biological oxygen concentration is, and how often it is in contact with the atmosphere. We’ve measured it with repeated profiles, looking for sharp gradients in temperature and salinity, indicating a lack mixing (which smooths gradients) further down.
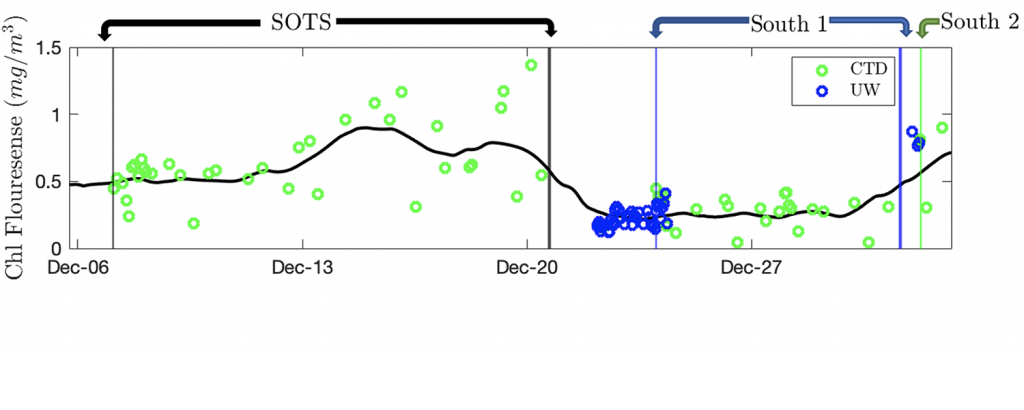
b) The Chlorophyll Concentration, estimated with fluorescence, gives a good indication of how many phytoplankton are in the surface; however it doesn’t tell us how fast they are photosynthesizing, or how much of the oxygen they produce is being consumed. We’ve measured Chl. with a fluorometer attached to the CTD as well some discrete, underway samples.
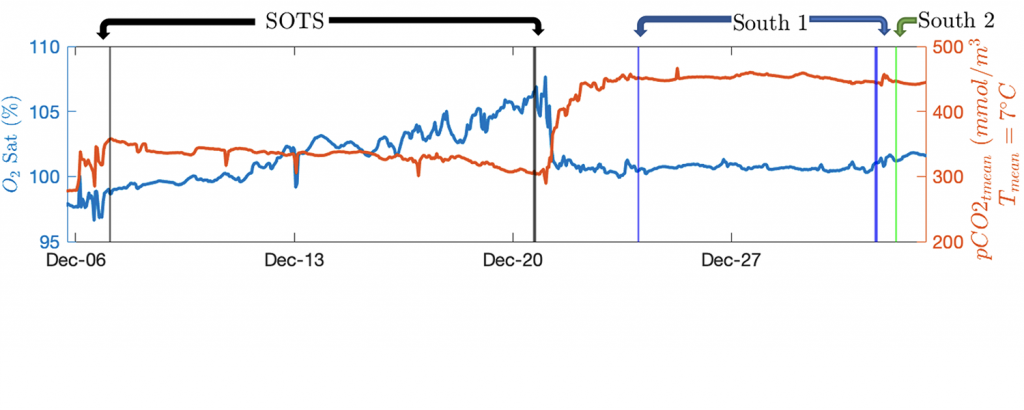
c ) The Oxygen Saturation, expressed as a percent of what could be held at equilibrium, and pCO2, corrected to control for changes in temperature, records show how the two gasses dance together. An increase in oxygen is tied to a decrease in CO2 and indicates an increase in photosynthesis or decrease respiration. These changes are tied to Net Community Production, but the specifics are complicated by coincident physical processes. Gases were measured continuously underway.
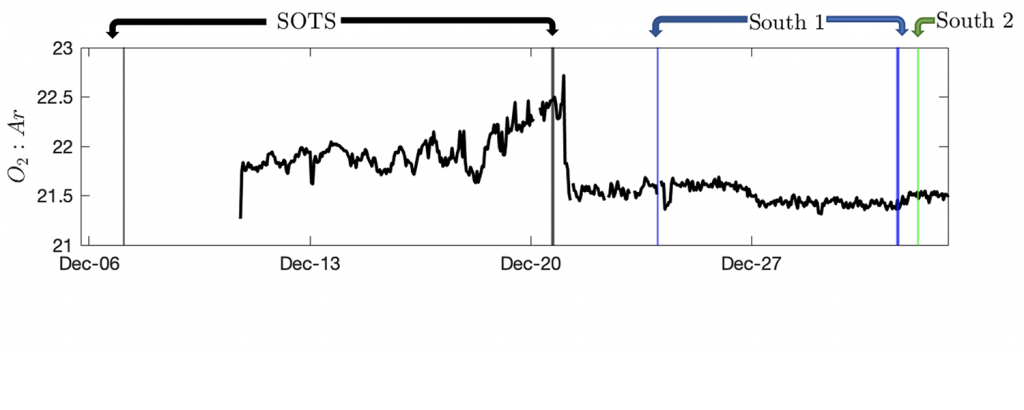
d) The 02:Ar ratio helps fill in the gaps, providing a correction for physics and allowing us to eventually compute net community production, or the difference between how much chlorophyll cells are photosynthesizing and how much other plant and animal cells are respiring (or consuming oxygen). The 02:Ar ratio was measured continuously (after a hiccup or two) with the EIMS.