Down the sink: Following carbon in the Southern Ocean
24 January 2024
The Southern Ocean plays a crucial role in the global carbon cycle, responsible for about 40% of the total global ocean uptake of human-induced carbon dioxide emissions.
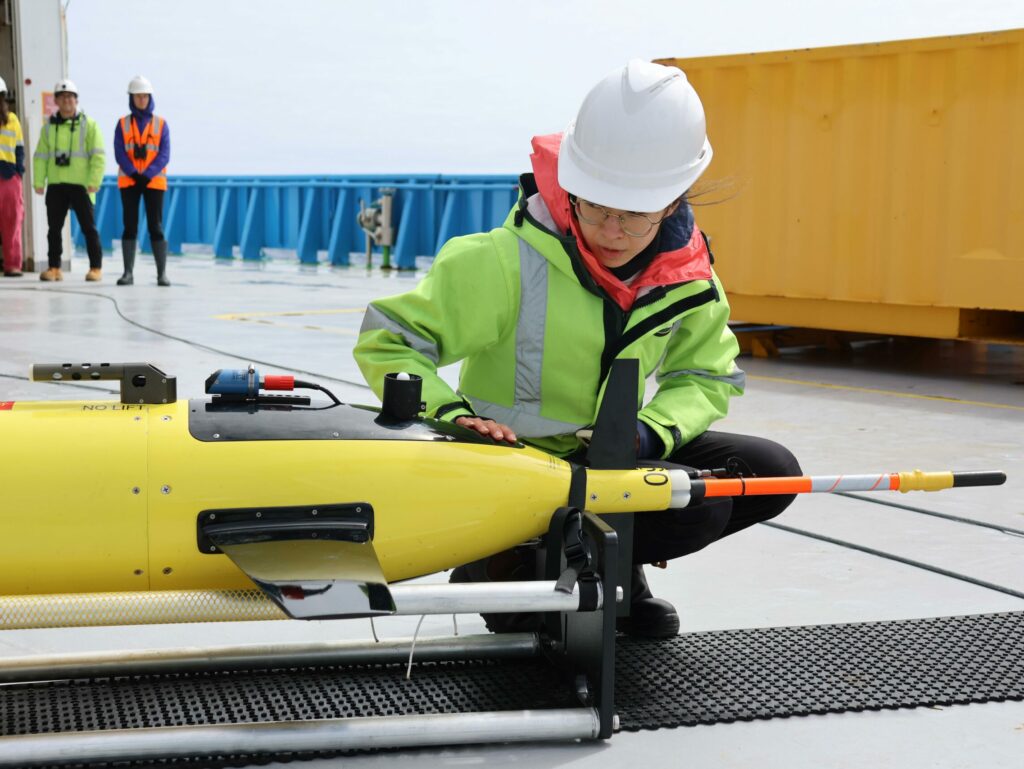
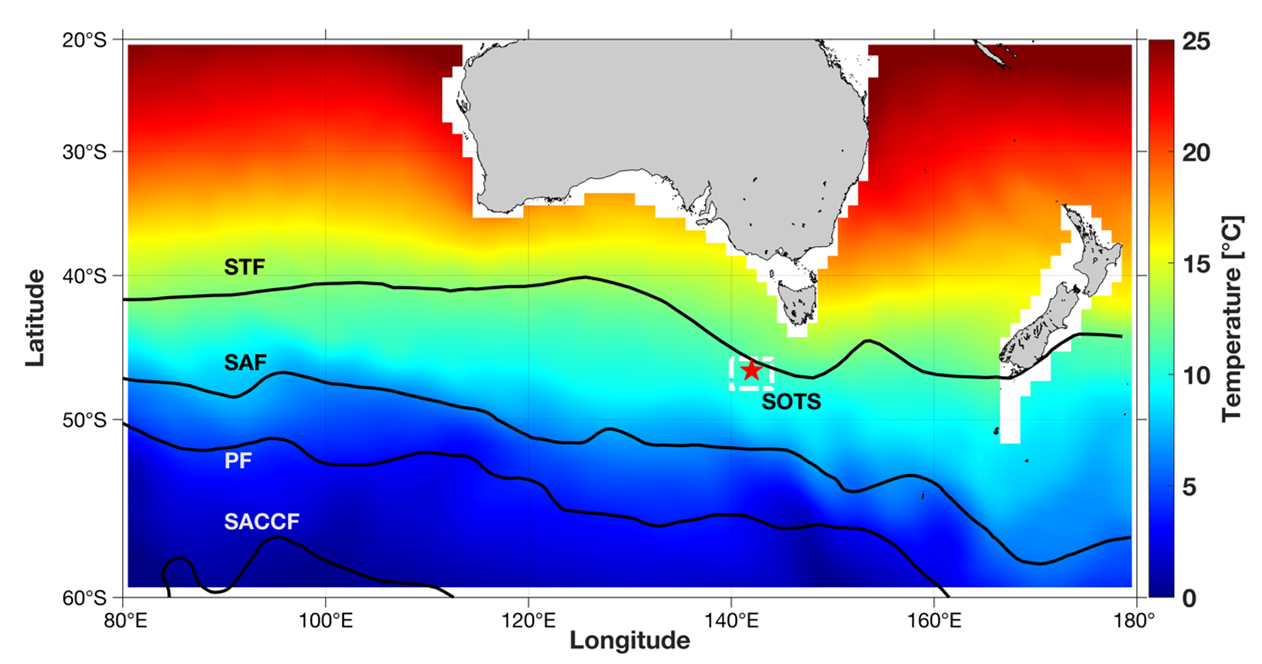
The Southern Ocean Time Series (SOTS) site southwest of Tasmania provides a valuable long-term opportunity to explore the variability of the ocean carbon cycle. SOTS is part of Australia’s Integrated Marine Observing System (IMOS).
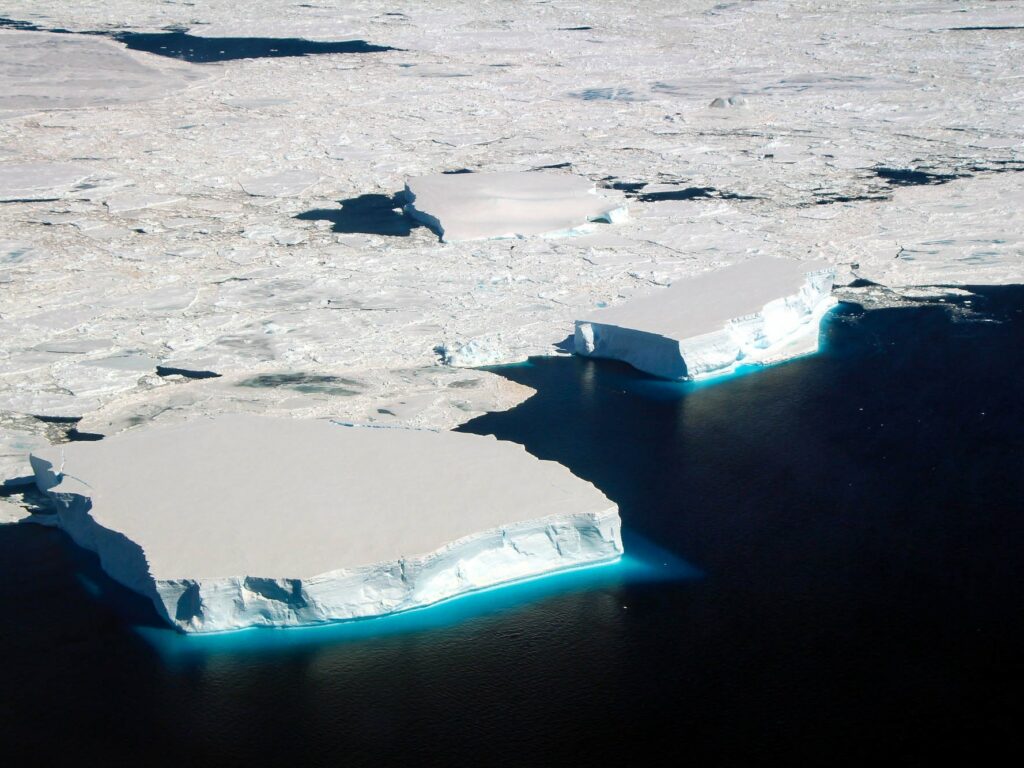
The sub-Antarctic zone, where the SOTS site is located, is important for its influence on the exchange of carbon dioxide (CO2) between the ocean and atmosphere.
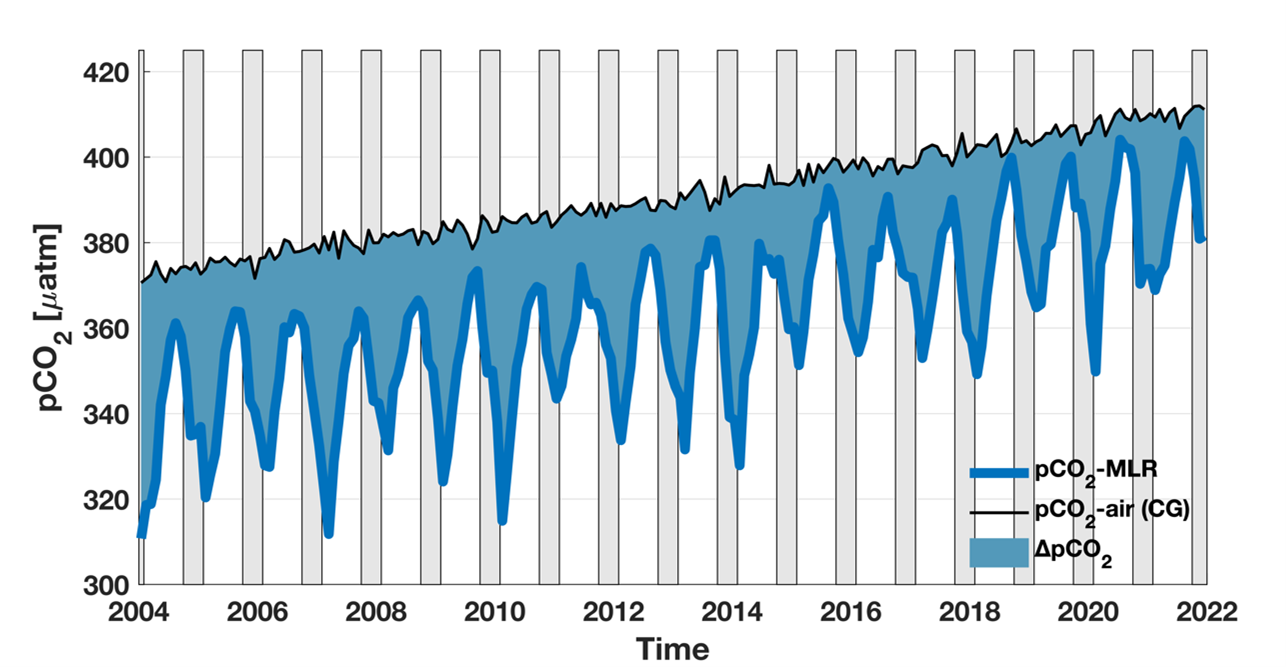
Recently a compilation of nearly a decade of observations from the SOTS observatory between 2011 and 2022 revealed changes in ocean chemistry resulting from CO2 uptake, and for the first time, direct measurements of an increase in the magnitude of the ocean’s seasonal CO2 cycle.
Now Xiang Yang, a PhD student with the Australian Antarctic Program Partnership (AAPP) at the University of Tasmania, has extended this SOTS record to cover two decades.
“By combining observations from SOTS with data from satellites, Argo floats and ships, we developed a model to compute the air-sea CO2 exchange, that extends and fill in gaps in the SOTS records from 2004 to 2021.”
“We found that CO2 partial pressure, or pCO2, in the surface ocean is increasing faster than in the atmosphere. This means that the SOTS neighbourhood has acted as a net carbon sink in the last 20 years to absorb human-generated CO2 from the atmosphere,” he said.
Mr Yang and his co-authors also explored what drives the CO2 exchange between air and sea.
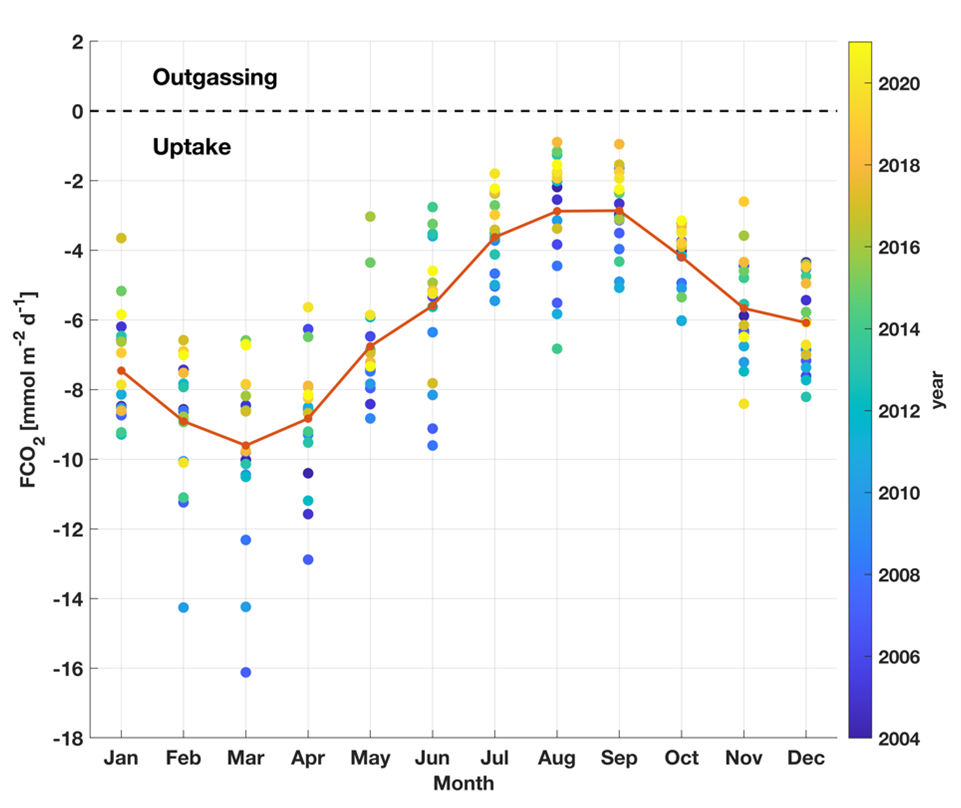
“The strongest sink period is from February to April, when biological activity predominantly impacts CO2 as phytoplankton bloom in spring and summer. The movement of water driven by eddies and ocean fronts is mainly responsible for the carbon variabilities in the autumn and winter.”
The CO2 exchange (or ‘flux’) is highly seasonal. The air-sea CO2 flux (or FCO2) is most variable in summer and more stable in winter, but the winter magnitude over the last few years has decreased to near zero.
The study, published in January in the journal Global Biogeochemical Cycles, also looks at the impacts of large-scale climate modes like the Southern Annular Mode (SAM).
“The positive trend of the SAM, when the strong westerly winds of the sub-Antarctic zone contract towards the pole, can slightly increase the ocean uptake of CO2 by enhancing wind-induced mixing”, Mr Yang said.
His ongoing PhD studies continue to investigate carbon pathways, using BGC-Argo floats and sediment trap records from the SOTS site to quantify how much particulate organic carbon has been transferred to the deep ocean from biological activity near the surface.
Read the full paper:
Yang, X., Wynn-Edwards, C. A., Strutton, P. G., & Shadwick, E. H. (2024). Drivers of air-sea CO2 flux in the subantarctic zone revealed by time series observations. Global Biogeochemical Cycles, 38, e2023GB007766.
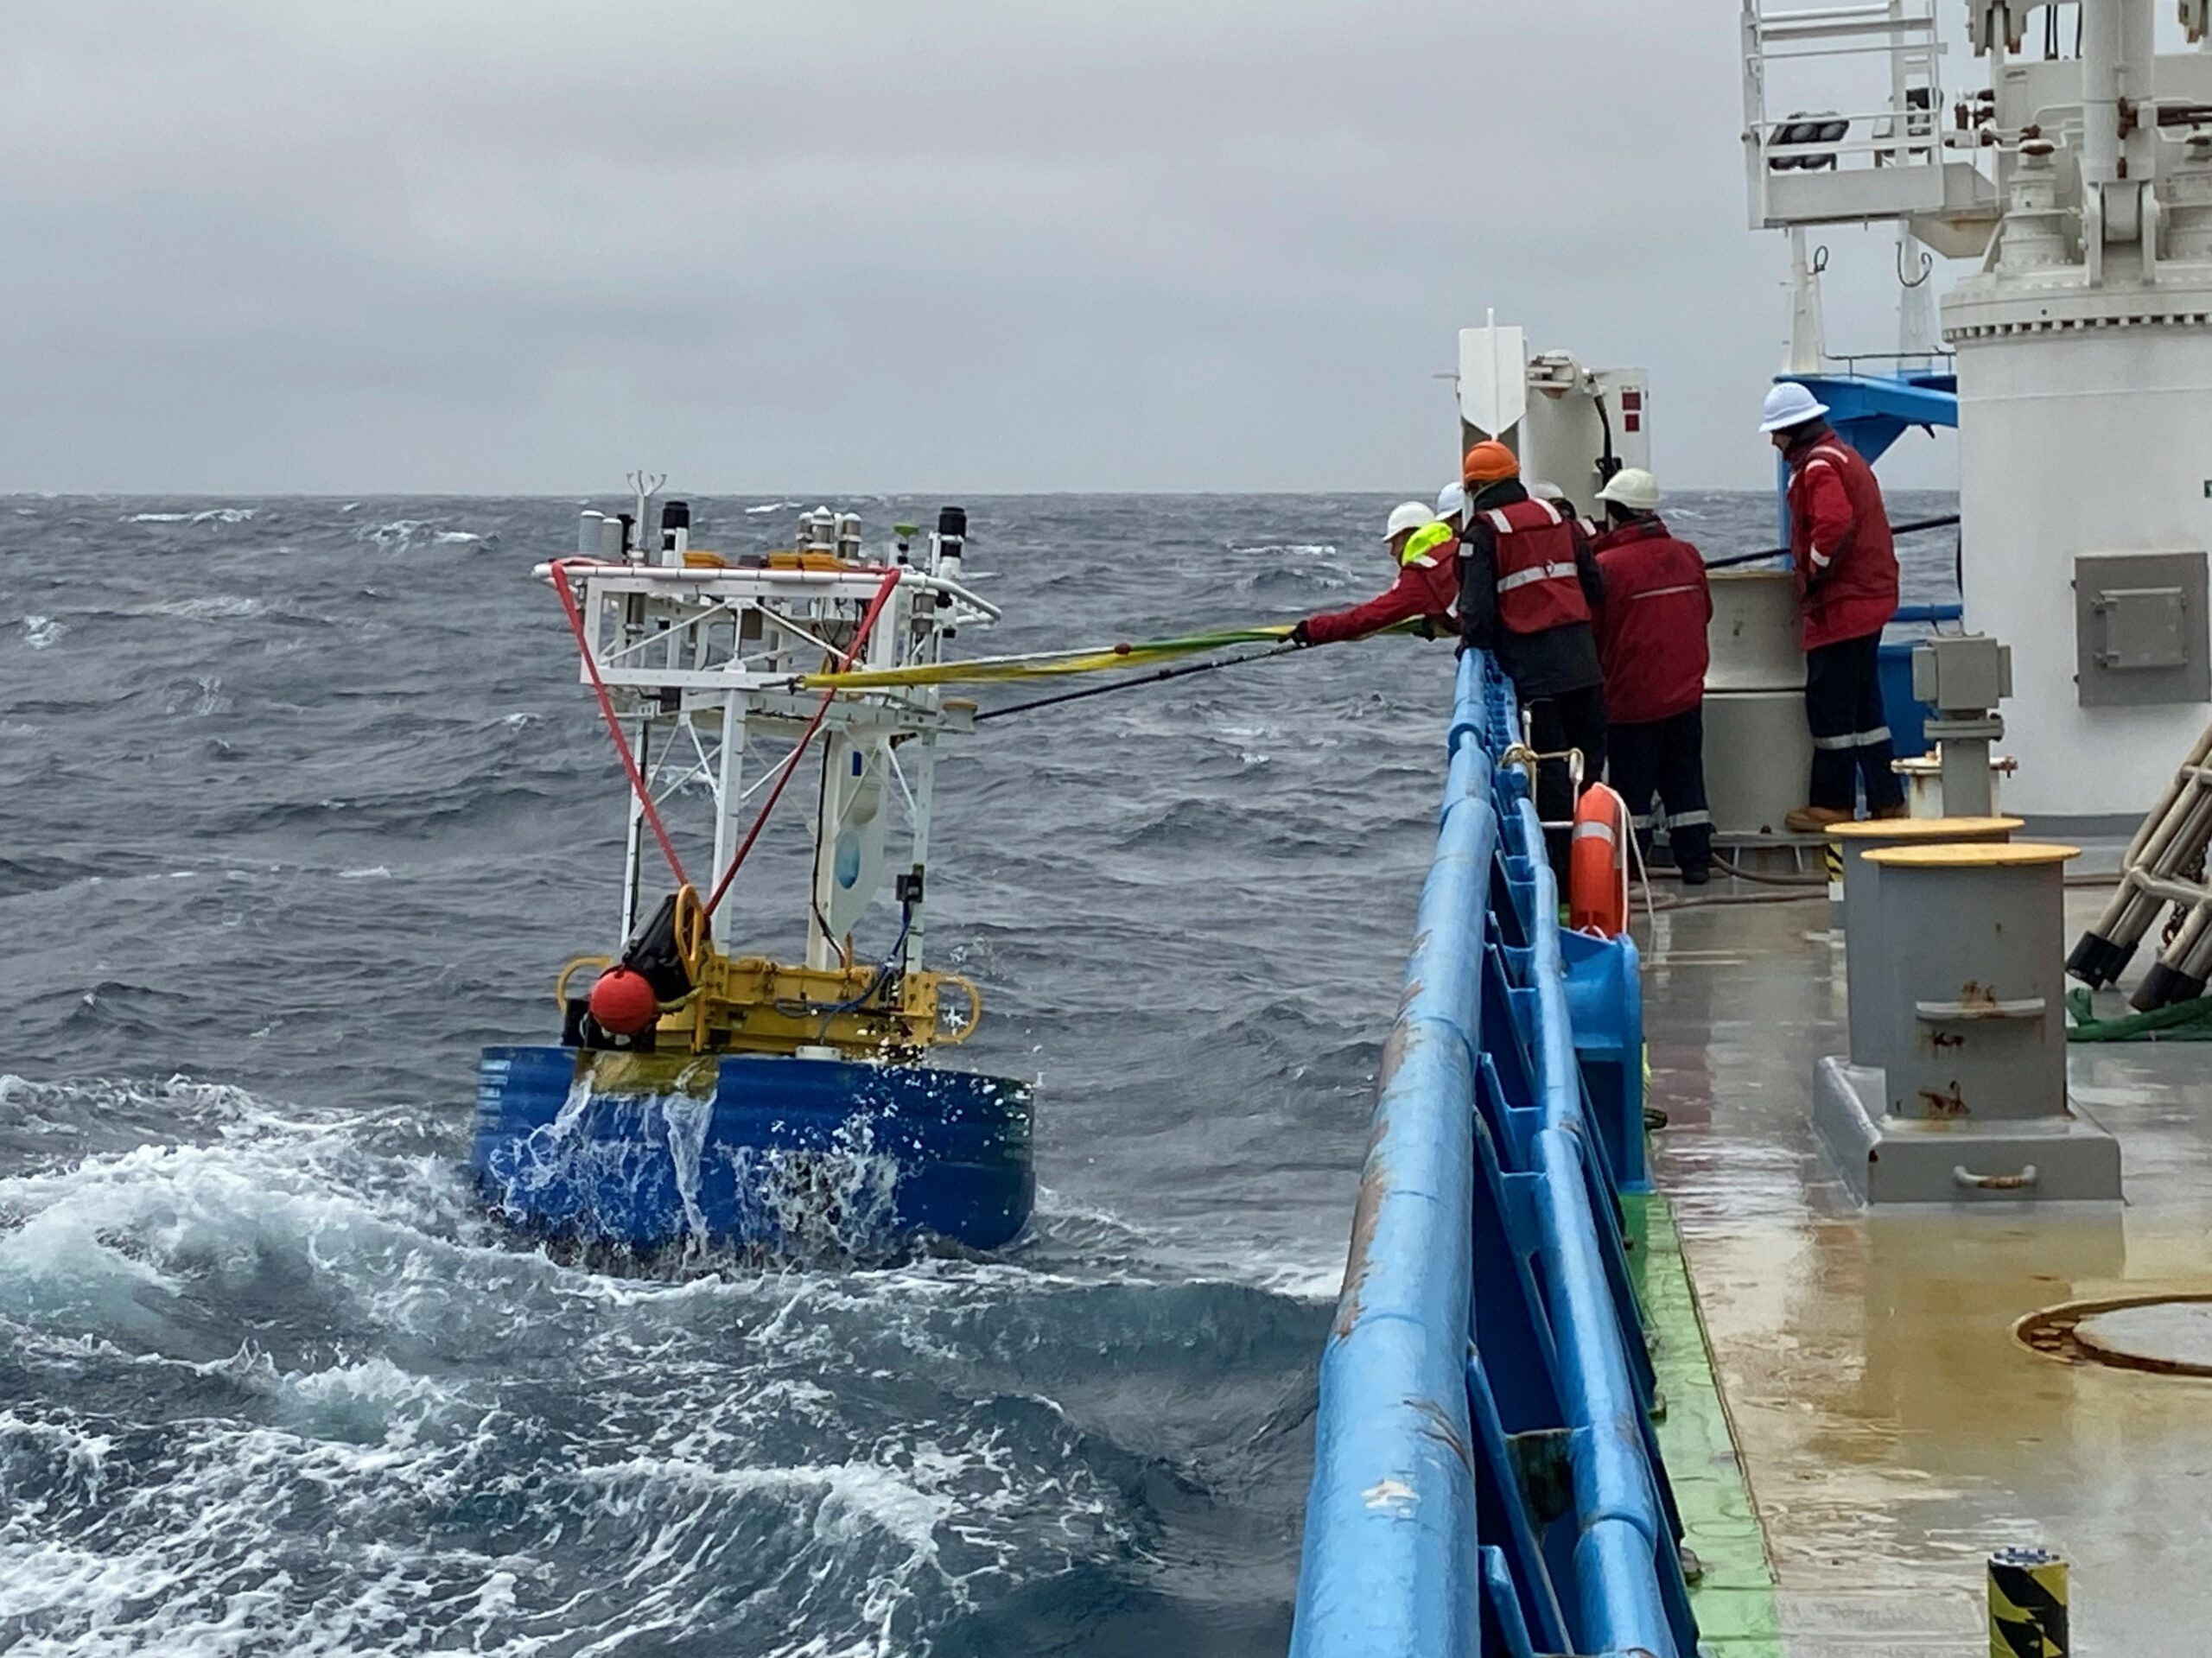
The IMOS SOTS site is operated through a partnership between IMOS, CSIRO Marine National Facility, CSIRO, Bureau of Meteorology, and the Australian Antarctic Program Partnership (AAPP).
IMOS and the CSIRO Marine National Facility are national research infrastructure supported by the Australian Government’s National Collaborative Research Infrastructure Strategy (NCRIS).