From big things, little things grow
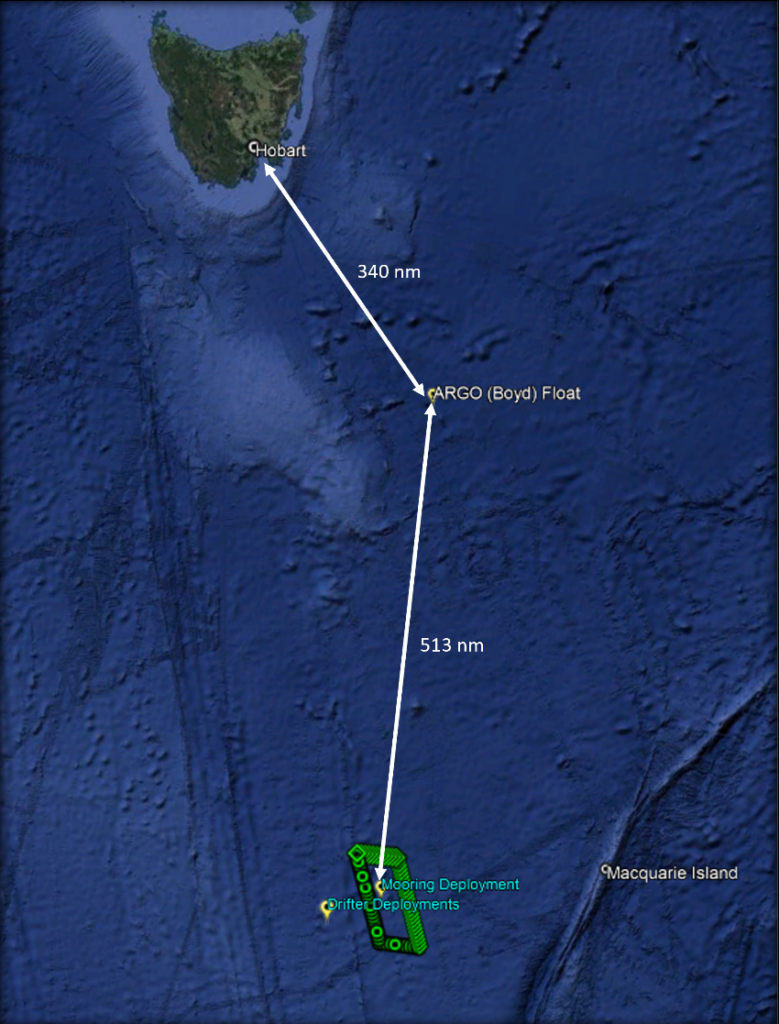
Why are we studying a very specific area of the Southern Ocean, bounded by a box 100km wide and about 200km long, on CSIRO research vessel (RV) Investigator? There are two main reasons.
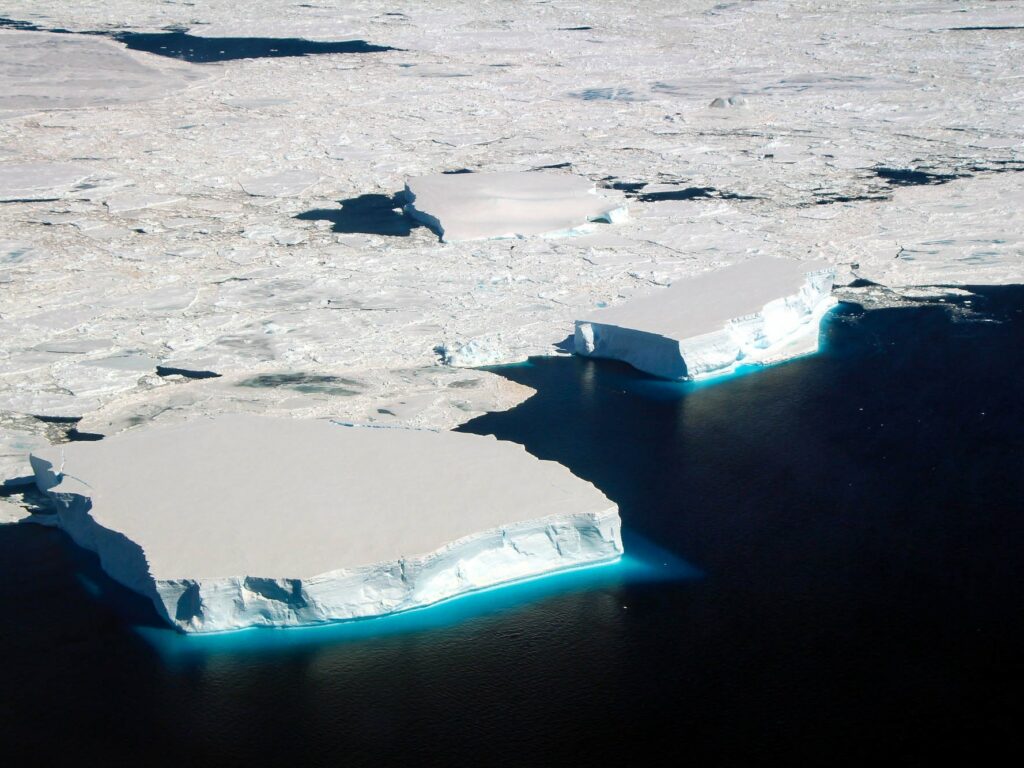
Firstly, the survey box (ok, it’s really a parallelogram) straddles the Polar Front, a natural boundary around Antarctica between warmer northern waters and cold polar seas. It’s part of the Antarctic Circumpolar Current, the world’s strongest current that swirls clockwise around the icy continent and for the last 30 million years, has helped to keep it frozen.
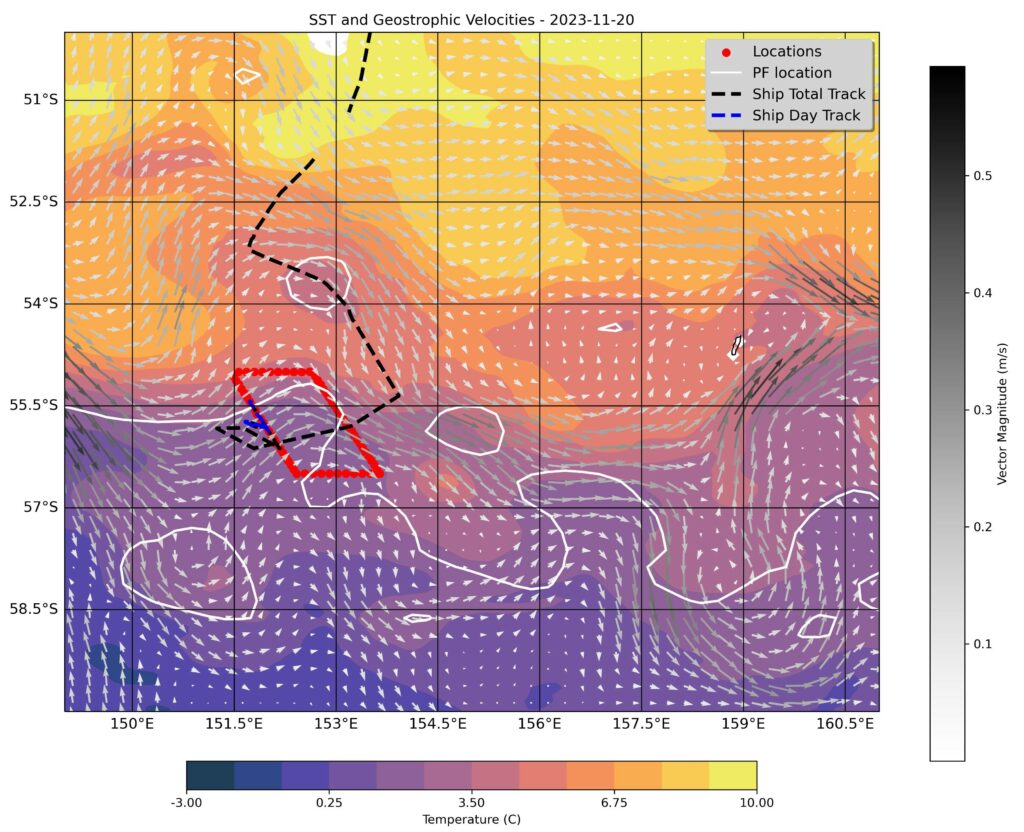
Within the survey box is a hotspot of eddy activity known as a ‘standing meander’, a north-south wave in the main flow, steered by the mountainous seafloor. Like in a river, energetic eddies spin off the waves in the main current and begin a life of their own. As the eddies rotate and interact with other eddies and the meander, the outer edges of the eddies get pulled off to form finer filaments that eventually get blended away into the background.
Most of the ocean’s motion-related energy is stored and lost in these finer-scale and relatively short-lived eddies and filaments. Circulation at these scales is thought to be responsible for transporting half of the heat and carbon from the upper ocean to deeper layers – a critical buffer against global warming.
“The Circumpolar Current all the way around Antarctica is like a big dam holding back the heat from the north and allowing Antarctica to stay cold,” says Dr Helen Phillips of the Australian Antarctic Program Partnership (AAPP) at UTAS, co-chief scientist of the FOCUS voyage.
“It’s leaky in a few places, and it’s always been leaky, but we’re seeing more heat coming through in recent times.”
“We’re working in a gateway where this heat is absorbed into the ocean and moved towards Antarctica. We want to understand how this gate is working, so that we can quantify how much heat is going to melt the ice,” says co-chief scientist Dr Benoit Legresy of CSIRO and AAPP.
“Not only are we are validating what the satellite is measuring in the most challenging environment, but also where the ocean signals are the strongest.”
We’ve been here before on a voyage in 2018, so we’ve got to know the neighbourhood reasonably well.
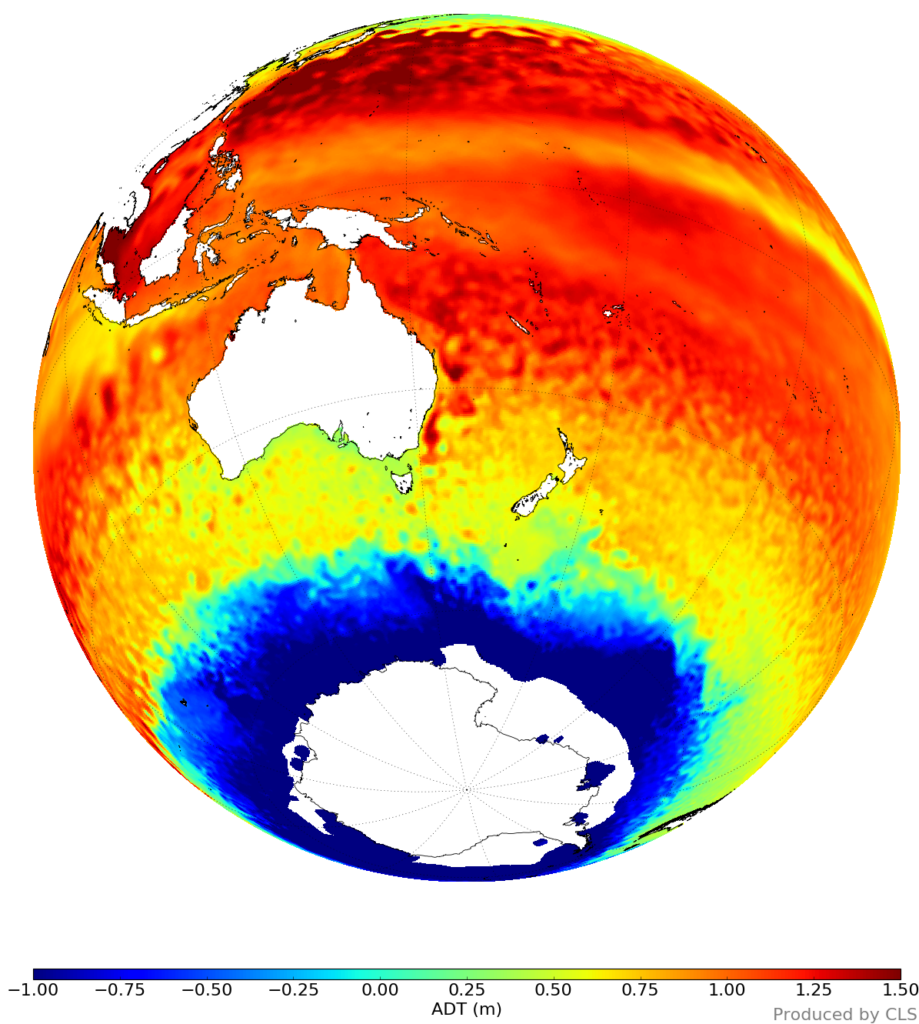
Secondly, there’s a new satellite in town. The SWOT satellite carries an altimetry radar that precisely monitors the height of surface water on Earth, or in our case, the ocean. Orbiting at an altitude of 891km, it detects differences in sea surface height to a matter of centimetres, in a swath 120km wide. The criss-crossing paths result in overlapping measurements over most of the globe with an average revisit time of 11 days.
And that’s why we’re here, in the middle of the Antarctic Circumpolar Current, right now.
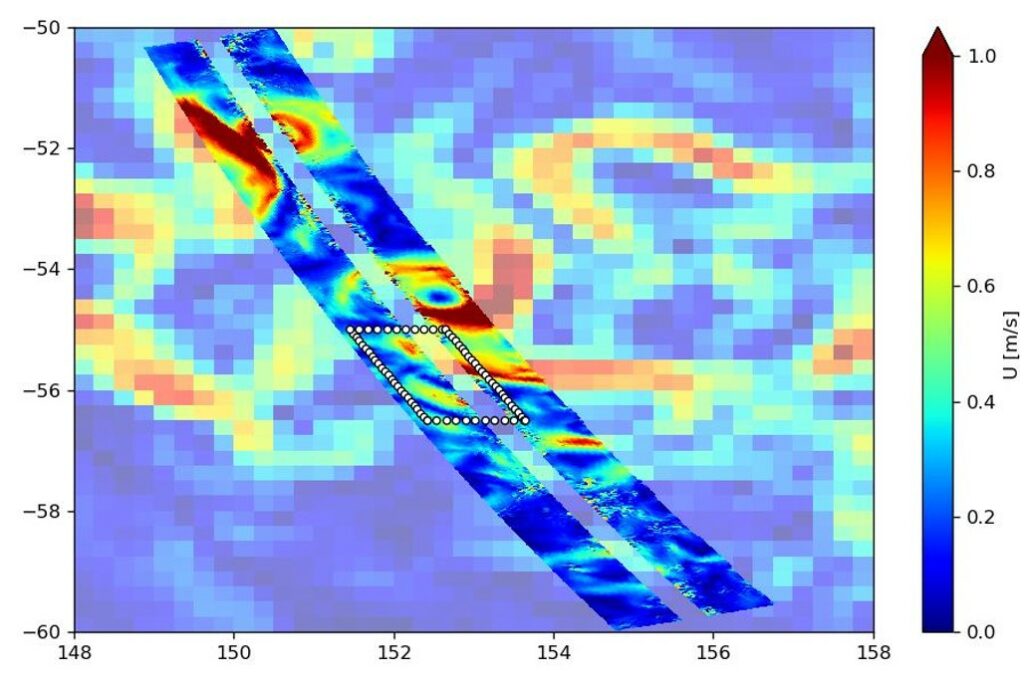
During November and December, the SWOT swath passes through our survey box seven times. We can figure out the density and speed of currents by measuring the ocean’s height with SWOT’s altimetry data. For instance, denser waters sit lower, and lighter waters stand taller. The differences between heights of the sea surface helps us calculate the speed of the current.
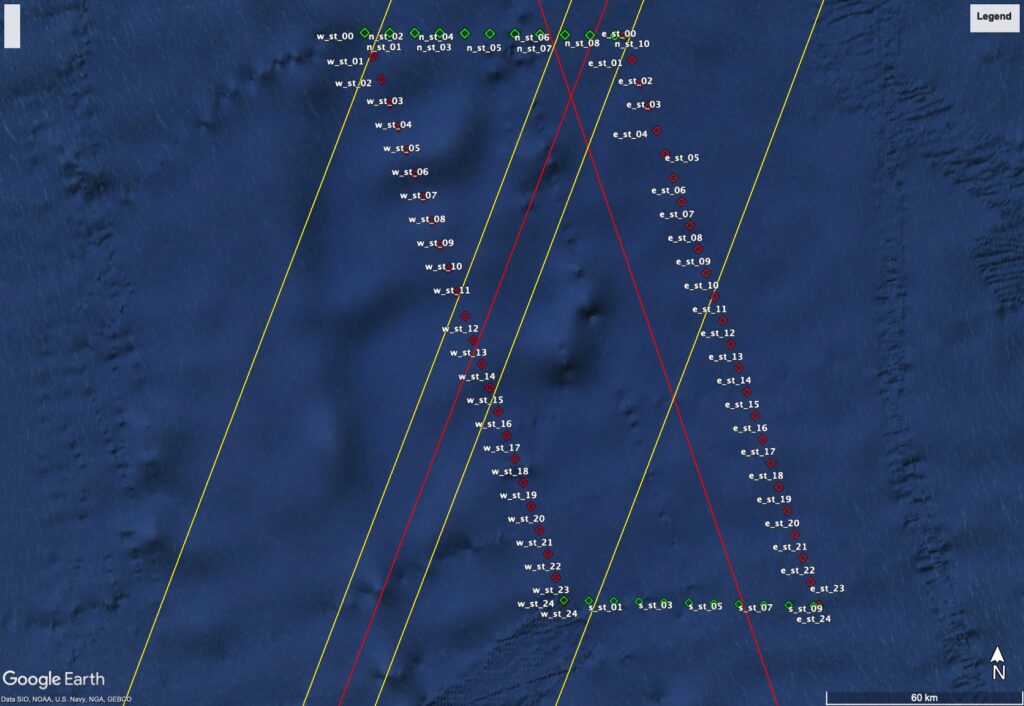
We’re coming from all angles with a full oceanographic toolbox. As the satellite passes overhead, we’re on the water releasing instruments into the survey box, that ‘taste’ the properties of the ocean and measure the forces driving the transport of heat and carbon here:
The tall mooring we’ve anchored in the middle of the survey box is in place for the next 18 months, measuring salinity, temperature, oxygen, and current velocity from the seafloor 3.6km deep to the near-surface every ten minutes.
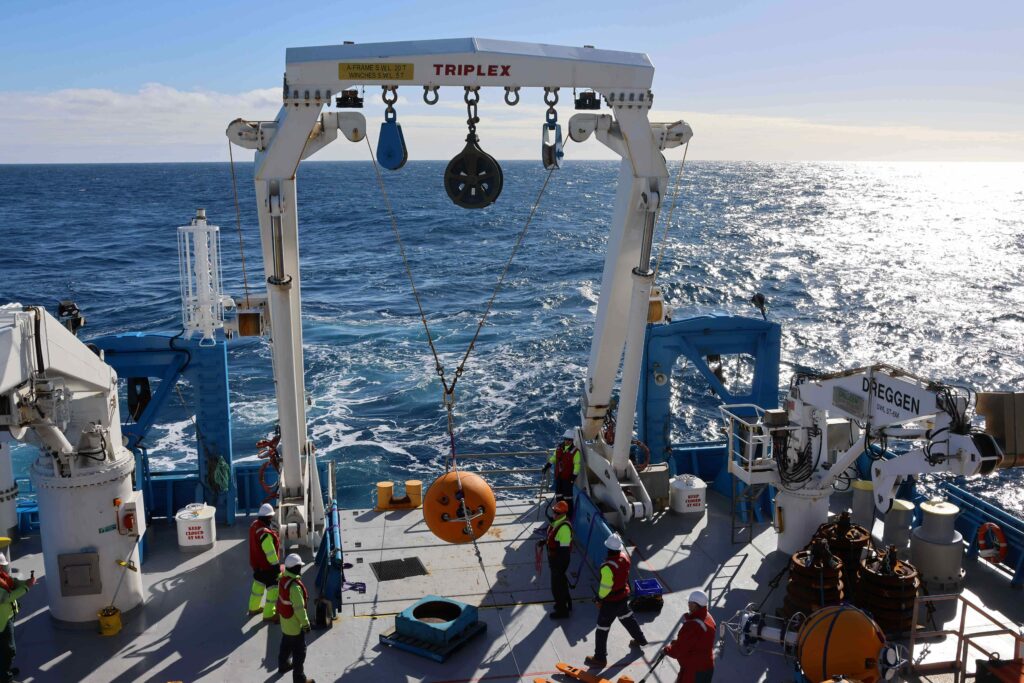
The surface drifters we’ve released have caught a ride with eddies and are now looping around the mooring and across the satellite swath. They’re measuring current speed and direction, sea surface temperature and pressure. Their data are picked up by weather forecast centres around the world, improving forecast accuracy.

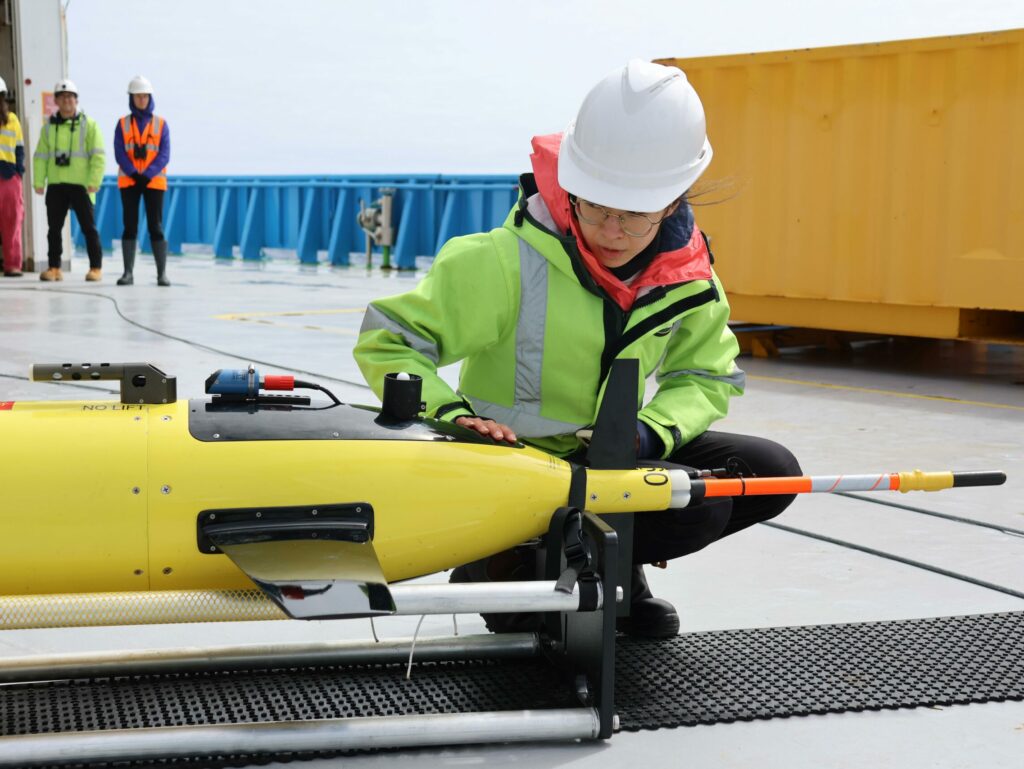
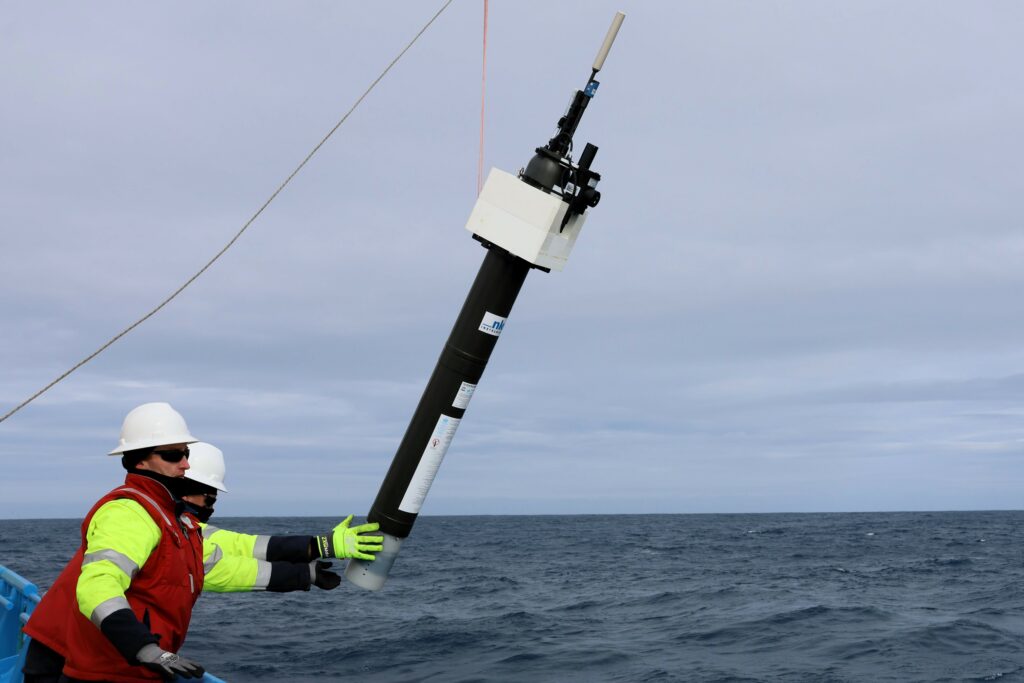
Enhanced Argo profiling floats are moving with the currents and mapping water masses between the sea surface and 2000 metres deep. They include the BGC Argo floats that are enhanced with sensors to measure oxygen, carbon, and nutrients to tell us about the ocean’s uptake of CO2 and changes in the ecosystems. The EM-APEX floats are enhanced to measure ocean currents and turbulence. The basic Argo measurements are temperature, salinity, and pressure. Watch how they’re deployed here.
Once deployed from the ship, underwater gliders are remotely piloted from Hobart and the US to zig-zag back and forth across the Argo trajectories so that we understand the gradients the Argo floats are measuring across.

During satellite passes, we’re towing the Triaxus (an instrument for high-speed oceanographic data gathering) through the swath to build a comprehensive picture of a horizontal slice of the ocean by undulating up and down through the upper 300m of water. Watch how it’s returned to the ship here.

And around the clock, the CTD (conductivity, depth, temperature) rosette is plumbing the depths, giving us water samples to be tested for nutrients, oxygen, carbon, and other vital signs.

“The satellite gives us the surface patterns, which show the changing height of the sea surface and the gradients across that drive the horizontal currents,” says Helen Phillips. “But underneath that surface is all this vertical movement taking heat and carbon out of the atmosphere and putting it into the ocean.”
“Being able to pair that surface view from the SWOT satellite with what we can measure with our instruments gives us a really valuable three-dimensional picture of what’s driving these processes and how they might change as the ocean heats up and winds strengthen.”
“From our previous work, we know there are these large eddies that are very important for moving heat around in the ocean, but with the SWOT satellite we can see these very fine-scale features that are breaking away from these eddies that we think are actually doing most of the work.”
Benoit Legresy says the SWOT data coupled with all the ship-based measurements will take us from slow-motion, low-resolution oceanography to real-time high-definition.
“By validating the satellite data from a high energy environment, the FOCUS voyage will enable the application of SWOT data to the rest of the Antarctic Circumpolar Current,” he says.
“This will underpin improved climate projections and ocean forecasts by delivering knowledge needed to improve the representation of the influence of small-scale motions on large-scale dynamics.”
As Helen Philips says, “ultimately we want to turn daily maps of ocean sea surface height from satellites into daily maps of the movement of heat in the Southern Ocean toward Antarctica. This will help governments and communities plan how to adapt to rising sea levels and how fast they need to act.”
The SWOT (Surface Water and Ocean Topography) satellite is jointly developed by NASA and French space agency CNES. Two of the gliders are from Caltech, one from CSIRO. On land, piloting of the gliders is supported by CSIRO, Caltech and other universities around the world. Drifters provided by the Bureau of Meteorology and National Oceanic and Atmospheric Administration (NOAA). EM-APEX floats provided by the University of Washington. Woods Hole Oceanographic Institution (WHOI) is providing turbulence analysis of Triaxus data. The voyage uses Copernicus mapping services to assist targeting the observations. In December 2023, the French Antarctic supply ship L’Astrolabe will provide fine resolution temperature profiles surrounding the FOCUS survey site.
This research is supported by a grant of sea time on RV Investigator from the CSIRO Marine National Facility which is supported by the Australian Government’s National Collaborative Research Infrastructure Strategy (NCRIS).